As the city of Harrison, Ark., struggles to overcome a troubled racial history that goes back more than a century, an array of local extremists is making it tough.
HARRISON, Ark. — For more than a century, the ghosts of terror and hate have haunted this nearly all-white city in the Ozark Mountains.
In 1905 and again in 1909, white mobs chased the entire black population — about 115 men, women and children — out of town, save for one old woman. Even now, Harrison, a city of 13,000 residents, is known as a place blacks avoid, especially after the sun goes down.
Today, fewer than 50 African Americans live here.
But a group of Harrison residents, including the mayor, the head of the Chamber of Commerce and a black evangelist, are working mightily to change the city’s reputation. They call themselves the Harrison Community Task Force on Race Relations and they want the country to know that their city is open to everyone.

It has not been easy. There is a man who resides some 15 miles away on a hill, down a rutted dirt road, past a goat farm and across a flooded creek, and who casts a long, dark shadow over Harrison and its fight for its future and its soul.
His name is Thomas Robb. He is a minister of the white supremacist theology of Christian Identity and the longtime leader of the Knights Party, one of the longer-lived Ku Klux Klan organizations in the country. The group is also known as the Knights of the Ku Klux Klan.
To the great frustration of city officials, Robb and the Klan appear early and often in Google searches and media reports about Harrison. While Robb uses a Harrison mailing address for Klan business, the Knights Party is actually located 15 miles away in a compound that includes Robb’s home and church just outside tiny, rural Zinc, Ark. “The Klan isn’t even in Harrison,” the mayor, Jeff Crockett, complains. “They’re way out in the boonies.”
But the geography doesn’t really matter. The perception is that Harrison is a Klan town. That’s why for the last 11 years and counting, the Task Force on Race Relations, a largely white group of elected officials and preachers, school teachers and police chiefs, bankers, college students and a few of Harrison’s handful of black residents, have come together to counter the city’s racist reputation and create a more racially welcoming present and future. They put on diversity seminars at the high school, Black History Month events at the public library and sponsor scholarships at the local community college.
This April, the task force and the city hosted a nonviolence youth summit around the anniversary of the assassination of Rev. Martin Luther King Jr. Dozens of high school students — black, white and Latino — were bused into Harrison from across the state for the event, including the symbolic burial of racism in a grave near City Hall.
The task force’s mission: Reconciling the past. Recognizing the present. Reaching for the future.

“The perception of Harrison as a racist place attracts people who want to be a part of that,” said Layne Ragsdale, who is white and a longtime member of the task force. “Unless we change that perception, in 25 years we will be that community. Those will be the only people who will want to come here. It’s especially important for the white community to say Robb doesn’t speak for us.”
Harrison is not alone in its struggle. There are communities all over America that were once racial battlefields, places where black Americans were lynched, expelled, bullied, robbed and otherwise mistreated by their white neighbors. Think of Pulaski, Tenn., the town where the original Klan was born in late 1865 and that still faces a Klan rally every year that helps cement its unsavory, and undeserved, reputation. And there are towns where a particularly horrible racial crime has tarred a community as irrevocably racist even though that’s often unfair. Jasper, Texas, where James Byrd Jr. was dragged to his death behind a white man’s pickup truck in 1998, is just such a place. It is famous worldwide for a racial atrocity.
But Harrison has a special, burning cross to bear. It’s not only a past of racial violence that scars the town. It’s the presence of Thom Robb, the people he and his friends attract, and the reputation they have helped to build.
Love and Hate in Harrison
As troubling as the thought might be, Robb may speak for more people than the task force wants to believe. Or at least have their ear. “We are constantly stopped in the stores by people wanting to shake our hands, or vent their anger toward the Task Force and their attempt to push white guilt upon our people,” he wrote recently in the white nationalist Web forum Stormfront, adding that he and his family “are truly well received in the whole of the community.”
Perhaps so. Even his critics in town admit that when he goes into Harrison to visit his son’s law office on the courthouse square or to shop at Walmart, Robb is friendly, polite and doesn’t use the N-word. He prefers “Negro.”
Robb insists city officials, business leaders and the rest of the world have him and the Knights Party all wrong. He calls himself “National Director,” not “Imperial Wizard,” wears suits and ties, and only dons his robe and hood for an annual “cross lighting” ceremony — a media-friendly way of saying “cross burning,” the Klan’s fiery symbol of terror.

He has been in these parts for 40 years and swears he is all about love, not hate. Never mind the Klan stuff. That’s just tradition. He says he has nothing against blacks or Jews or Catholics or brown-skinned immigrants. He just loves white people so much that there isn’t any room left in his heart for anyone else.
At one time, Harrison must have seemed like the promised land to Robb and his ideological kinsmen. It was smaller than it is now and nearly all white — 95% these days. It also had a reputation for white-hot racial hostility, dating back more than 100 years to the race riots that destroyed Harrison’s African-American community. After that, the city quickly became known as a “sundown town,” a place where if you were black you better not be caught shopping, walking or breathing air after dark. Even in the daylight, you were not welcome. That latent sense of terror still exists in the hearts and minds of many African Americans in Arkansas when the name Harrison is mentioned.
The northwest corner of Arkansas where Harrison is located has been home to more extremists than Thom Robb. Its overwhelmingly white population, conservative religion and politics, and rural, mind-your-own-business ethos have all helped make it one of nation’s gathering points for such people.
In the 1960s, Gerald L.K. Smith, a Nazi enthusiast who was once the most important anti-Semitic organizer in America, retired to Eureka Springs, less than an hour from Harrison. There, he organized a huge, mountaintop statue of “Christ of the Ozarks” and a Passion Play that is still performed today. In 1976, white supremacist James Ellison bought a farm near Bull Shoals Lake, also an hour in the opposite direction from Harrison, where he established The Covenant, The Sword, and The Arm of the Lord, an armed Christian Identity group. After members murdered a state trooper and tried to blow up a natural gas pipeline, federal agents raided the compound in 1985, discovering a major cache of illegal weapons and a barrel of cyanide intended for use poisoning the water supplies of several major cities.
Also in the 1980s, Mike Hallimore moved to Jasper, less than 20 miles from Harrison, and set up Kingdom Identity Ministries, the world’s leading purveyor of materials related to Christian Identity, which alleges that Jews are biological descendants of Satan and people of color have no souls. Hallimore says the Bible authorizes the murder of “race mixers” and has predicted that “one day … people will be hanging from the lamp posts in this country.” To this day, Hallimore’s ministry has an office on Chestnut Street in Harrison.
Harrison is the Boone County seat, located about 30 rolling miles south of Branson, Mo., the neon-lit, country-music playground of the Ozarks. “People of all colors should be able to come here and feel comfortable,” Mayor Crockett said in an interview in his office on the second floor of City Hall. “I got in an elevator in Little Rock with a black man not long ago and we struck up a conversation. When I told him I was from Harrison, he didn’t want to talk to me anymore. That reaction and reputation is what we’re trying to change, trying to overcome.”
The local white supremacists are attempting to paint the mayor as “anti-white” — a standard allegation thrown around by the racist radical right. Crockett laughs at that; the mayor is white himself, as are some of his best friends and the vast majority of his constituents. What he does confess to being, and proud of it, he says, is a patriotic American who knows in his bones that racism, no matter how it is dressed up, is not only immoral, it is bad for business. “We’re finding when people, even if they’re white, transfer into the area, they don’t want to live in Harrison because of its reputation,” he says. “We lose the tax base, we lose the real estate sales. We lose.”
Apparently alarmed by the efforts of the task force, Billy Roper, a former schoolteacher, neo-Nazi-turned-Klansman and close Robb ally, recently put out a call to “racial patriots” to come to Harrison.
“There is an ongoing struggle here between White Nationalists, including Knights Party members, and local Anti-White activists, including the Mayor and ‘Task Force on Race Relations’,” Roper wrote in Stormfront. “This is where we will make our stand. We encourage others to join us. This is the front lines.”
Battle of the Billboards
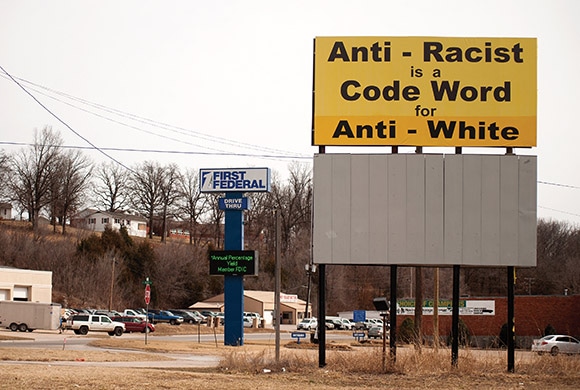
The frontlines in the struggle for Harrison’s identity had been quiet for some time, until the city awoke on Oct. 15 to a bright yellow billboard overlooking a well-traveled city street. The sign proclaimed in black letters that “Anti-Racist is a Code Word for Anti-White.” That is a popular slogan of the white nationalist movement, but no one took credit for putting the words up for the city to see.
Almost immediately the Harrison Chamber of Commerce was flooded with calls from city residents wanting the sign removed, said Patty Methvin, president of the chamber and facilitator of the task force. “It caused quite an uproar,” Methvin said. “We were proud of that.”
About 30 people, including the mayor and other members of the task force, held a pro-diversity demonstration at the billboard, but it was not taken down. Karyn Isaacs, a black graduate student from New York City and task force member, was one of them. “Whoever put that up has a lot of hatred in their heart,” Isaacs said.
Isaacs first started visiting Harrison in 2007 with a friend who grew up here. He warned her there were almost no blacks and the Klan was headquartered not far from town. But she loved the beauty of the hills, the quiet of the nights. Now she divides her time between New York and Harrison. “It’s a very quaint town,” she said. “I love the rural life. But do I get stared at sometimes? Absolutely. Does it bother me? Absolutely not. I’ve never been called n—–.”
Almost.
She was shopping at the Walmart one day when a little white girl pointed at her like she was picking her out of a lineup.
“Darkie,” the girl said.
Isaacs was stunned as she watched the little girl and her mother walk away.
“I can’t blame the child,” Isaacs said. “It goes back to the parents and their ignorance.”
In late November, someone, standing in the bed of a pickup truck, vandalized the offending billboard. The words “Anti-White” were painted over and replaced with one word — “Love” — causing the sign to read “Anti-Racism is a Code Word for Love.”
The task force condemned the vandalism, but shared the sentiment. Still, the “Anti-White” wording was quickly restored. The “Love” was gone again. A local 47-year-old handyman named Chad Watkins was arrested and charged with a misdemeanor in the case. His Little Rock-based lawyer, Matthew Campbell, asked a friend, a black off-duty police officer from out of town, to accompany him to Harrison for a court hearing. The friend said no.
“And this was a big, old veteran cop, who shouldn’t be worried — and even he won’t go to Harrison,” the lawyer said. “When you’ve got 34 black people in a town that size, I don’t know how much progress you can actually see, even if they’re making progress. But they’re trying, trying hard. The task force is doing what they can to improve Harrison’s image outwardly. I don’t know if it’s possible to change Harrison internally when there is no black population. It’s a lot easier for citizens to cling to whatever racial beliefs they want.”
Nevertheless, the task force continues to try. In December, it put up two billboards of its own: “Love Your Neighbor,” they read.

But the billboard battle did not end there. In mid-March, a new billboard, allegedly sponsored by a group of anonymous Harrison business owners, went up directly beneath the original “Anti-White” sign. Its message was more subtle. It featured a huge picture of the smiling faces of a white family of four.
“Welcome to Harrison,” the billboard said. “Beautiful Town, Beautiful People, No Wrong Exits, No Bad Neighborhoods.”
Facing the Future
Harrison is a working-class city. A FedEx regional office employs 1,500 people from across the region. It is the largest employer in town. “Harrison is full of people who have pulled themselves up by their bootstraps,” says Carolyn Cline, a task force member and seventh-generation resident of Arkansas. “That’s the true character of our city.”
A website about “great retirement spots” says Harrison “receives generally good reviews.” The “surrounding landscape is lush” and “the fly fishermen favorite Buffalo River runs nearby.” The cost of living is 12% below the national average and the political leanings of the area, according to the site, are “very, very conservative.” The heart of Harrison is the restored courthouse square, ringed by a bookstore, the Lyric Theater, the offices of the Harrison Daily Times newspaper and other businesses, including the Robb law firm.
The website recommends Harrison as a retirement spot “although the town’s history may be off-putting to many.”
That history is indeed dark and painful. But unlike many places suffering from similar pasts, Harrison is trying to work through its history and deal with its unwelcome neighbors in the Klan. In the end, whether it succeeds or fails will be up to the efforts of individuals — people such as Alice Sanders.
Sanders, a black evangelist born and raised in Jim Crow Mississippi, knew nothing of Harrison’s history when she first came to town 10 years ago after living and preaching in Washington state. Sanders came to Harrison for a three-day revival in Zinc. She knew nothing of Thom Robb, either. She soon learned about both, but still decided to make Harrison her home. It is filled, she said, with churches and “people who love God.” But she also joined the Task Force on Race Relations to make her new home better.
“A lot of places I go don’t have the racial history of Harrison, but you can tell it’s there,” she said. “You can’t escape it. You have to change it. I’ve had people walk up to me in stores here and say, ‘I’m glad you’re here.’ The Lord said, ‘Make yourself visible, Alice.’ I said, ‘Lord, you have a sense of humor.’
“I can’t help being visible in Harrison.”